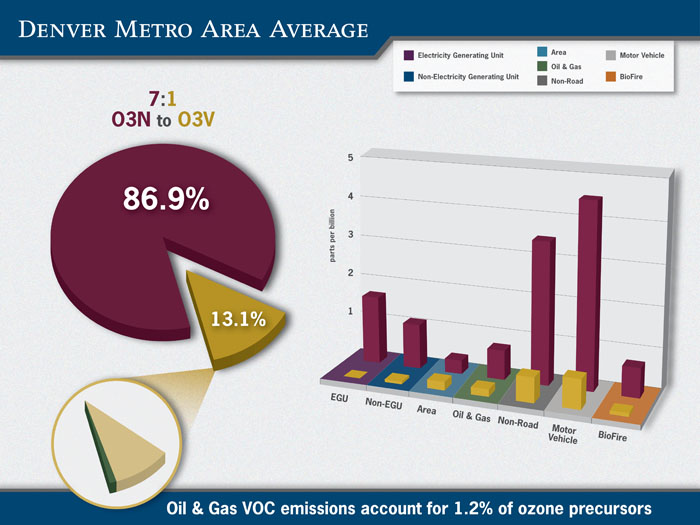
We often take standard pie charts and bar graphs from expert reports and enhance them to show additional layers of detail. Data can be organized and color-coded in a way that is detailed while still being easy to understand.
We often take standard pie charts and bar graphs from expert reports and enhance them to show additional layers of detail. Data can be organized and color-coded in a way that is detailed while still being easy to understand.
©Copyright 2000 - 2024 | Visual Advantage | All Rights Reserved